What is the role of energy and scientific advancement in the socioeconomic development of nations?
How do countries develop? What is development? Owen Barder1 argues that development is an emergent property of the socioeconomic system. He further expounds this idea by noting that development is not the sum of the well-being of people in the economy and it cannot be brought about simply by making enough people in the economy better off. Development, he argues, is instead a system-wide manifestation of the way people, firms, technologies and institutions interact with each other within the economic, social and political system. Specifically, development is the capacity of those systems to provide self-organising complexity. Self-organising complexity in an adaptive system cannot be deliberately designed; it arises from a process of continuous adaptation and evolution.
This is a complex topic to tackle so I have narrowed down my question to just how important energy is to the development of a nation, specifically, electricity and the role of scientific advancement. This is because electrical consumption is a measure of not just the ability to utilise electricity but a measure of just how good a country’s infrastructure is because electricity is complex to generate, transmit and use and like all other forms of energy it must be reliable and cheap. Attention to scientific advancements is also important as new and more complex goods and services are developed through research and the application of newly discovered or acquired knowledge. A nation that pays attention to and deliberately funds research and development will tend to have a more advanced and complex economy.
I will use the following measures to test my hypothesis:
- GDP per capita ($): Gross Domestic Product per capita. This measures the value produced per person in a country. It is calculated by dividing GDP by population and is measured in US dollars ($)2.
- Electricity consumption per capita (kilowatt-hours): The electrical energy consumed per person, calculated by dividing a country’s total annual electricity consumption by its population.
- Economic Complexity Index (ECI): A ranking of countries by the complexity and variety of the goods and products they produce and export. The more complex, specialised, and hard to replicate those goods and services are, the higher a country ranks on the index3.
- Number of scientific papers published per country.
Developing nations have been struggling to move to middle-income and finally high-income status. Loans, grants and donations have been poured into trying to alleviate poverty and improve the lot of these nations but sadly not much happens. Exactly what does it take to transform a struggling economy into a robust and complex one? Is it just money that is required? In this investigation, we will discover that the process of development is much more subtle than government-initiated economic projects and rather it is a complex function of the interactions between multiple systems in an organic manner that leads to a prosperous, complex and robust economy of a nation.
Data Sources
Data was acquired and assembled from multiple online sources listed below:
- Electricity consumption per capita (kWh) and GDP per capita ($) from the World Bank data repository4.
- List of oil-producing countries from Wikipedia, scraped using R5.
- Economic Complexity Index, Harvard University, (The Atlas of Economic Complexity by @HarvardGrwthLab, n.d.)6.
- Democracy Index from Economist Intelligence Unit, 20237.
- Gini Coefficient by Country 2023, n.d8.
The interactive figures extend this original analysis. They use same-year World Bank electricity, PPP income and population data; NSF fractional publication counts; and Harvard Growth Lab ECI for HS92 exports. Their controls, coverage, update date and definitions appear with each chart. They are new comparisons, not reconstructions of the original Power BI averages or screenshots.
Results and Discussion
Here is the Power BI dashboard.
1. Electricity consumption and income
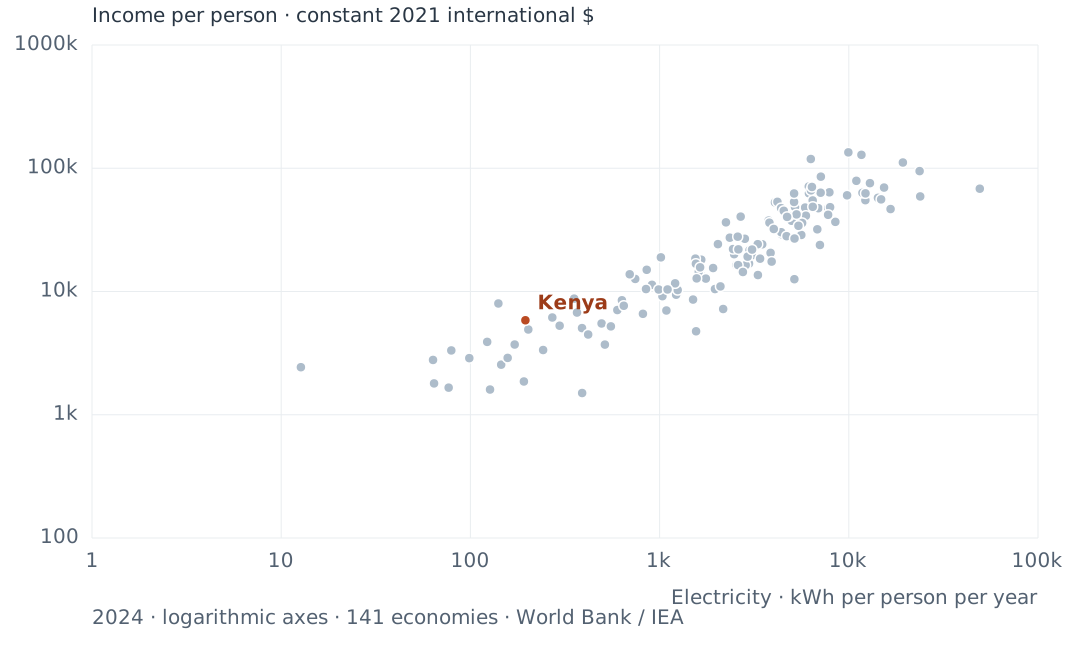
The interactive figure below is an updated analysis using same-year observations, rather than the multi-year averages in the original figure. Income is now explicitly measured in purchasing-power-adjusted, constant 2021 international dollars. The source data were retrieved on 9 November 2026; the opening year is 2024 because 2025 coverage is still incomplete.
Highlight up to six economies. Each dot represents one economy.
Static view · 2024 · snapshot 2026-11-09-fe53088a0f44. Interactive controls appear when the chart is ready.
View the data table
| Economy | Year | Electricity | Income |
|---|---|---|---|
| Albania | 2024 | 2,986.38 | 21,640.98 |
| Algeria | 2024 | 1,917.94 | 15,501.92 |
| Angola | 2024 | 353.46 | 8,752.80 |
| Argentina | 2024 | 2,822.10 | 26,771.97 |
| Armenia | 2024 | 2,477.67 | 20,078.78 |
| Australia | 2024 | 9,793.56 | 60,309.58 |
| Austria | 2024 | 7,896.83 | 63,787.99 |
| Azerbaijan | 2024 | 2,443.83 | 22,090.53 |
| Bahrain | 2024 | 23,845.73 | 59,060.18 |
| Bangladesh | 2024 | 632.10 | 8,486.78 |
| Belarus | 2024 | 4,415.27 | 29,135.95 |
| Belgium | 2024 | 7,098.81 | 63,311.28 |
| Benin | 2024 | 122.66 | 3,901.33 |
| Bolivia | 2024 | 911.28 | 11,329.15 |
| Bosnia and Herzegovina | 2024 | 3,859.68 | 20,578.50 |
| Botswana | 2024 | 1,660.36 | 18,107.61 |
| Brazil | 2024 | 3,068.10 | 19,652.37 |
| Brunei Darussalam | 2024 | 10,963.41 | 79,071.73 |
| Bulgaria | 2024 | 5,469.91 | 34,221.39 |
| Burkina Faso | 2024 | 145.44 | 2,548.50 |
| Cambodia | 2024 | 1,086.24 | 7,011.58 |
| Cameroon | 2024 | 202.31 | 4,916.93 |
| Canada | 2024 | 14,260.13 | 57,534.09 |
| Chad | 2024 | 12.71 | 2,430.73 |
| Chile | 2024 | 4,392.97 | 30,267.64 |
| China | 2024 | 7,037.74 | 23,841.48 |
| Colombia | 2024 | 1,545.96 | 18,481.84 |
| Congo, Dem. Rep. | 2024 | 126.98 | 1,601.71 |
| Congo, Rep. | 2024 | 270.96 | 6,152.57 |
| Costa Rica | 2024 | 2,350.14 | 27,325.05 |
| Cote d'Ivoire | 2024 | 365.94 | 6,747.04 |
| Croatia | 2024 | 4,630.39 | 42,828.80 |
| Curacao | 2024 | 5,610.16 | 28,762.06 |
| Cyprus | 2024 | 4,070.58 | 52,861.84 |
| Czechia | 2024 | 5,876.92 | 47,972.53 |
| Denmark | 2024 | 6,143.89 | 71,034.58 |
| Dominican Republic | 2024 | 2,033.51 | 24,229.89 |
| Ecuador | 2024 | 1,639.38 | 13,922.42 |
| Egypt, Arab Rep. | 2024 | 1,555.44 | 16,798.15 |
| El Salvador | 2024 | 1,207.92 | 11,647.02 |
| Equatorial Guinea | 2024 | 854.95 | 14,997.76 |
| Estonia | 2024 | 5,932.93 | 41,185.83 |
| Eswatini | 2024 | 1,101.53 | 10,386.21 |
| Ethiopia | 2024 | 157.38 | 2,892.22 |
| Finland | 2024 | 14,819.27 | 55,901.32 |
| France | 2024 | 6,443.05 | 54,799.35 |
| Gabon | 2024 | 1,015.77 | 18,923.66 |
| Georgia | 2024 | 3,485.89 | 24,146.62 |
| Germany | 2024 | 6,156.68 | 62,654.60 |
| Ghana | 2024 | 597.90 | 7,072.80 |
| Greece | 2024 | 4,988.60 | 37,474.28 |
| Guatemala | 2024 | 743.33 | 12,643.98 |
| Haiti | 2024 | 63.45 | 2,783.79 |
| Honduras | 2024 | 816.30 | 6,590.84 |
| Hong Kong SAR, China | 2024 | 6,311.32 | 66,186.04 |
| Hungary | 2024 | 4,812.45 | 40,747.20 |
| Iceland | 2024 | 49,241.15 | 68,230.36 |
| India | 2024 | 1,222.83 | 9,416.05 |
| Indonesia | 2024 | 1,611.12 | 14,470.72 |
| Iran, Islamic Rep. | 2024 | 3,910.49 | 17,484.13 |
| Iraq | 2024 | 1,755.70 | 12,725.04 |
| Ireland | 2024 | 6,298.24 | 118,833.31 |
| Israel | 2024 | 6,900.58 | 47,388.72 |
| Italy | 2024 | 5,136.68 | 53,284.87 |
| Jamaica | 2024 | 1,202.11 | 11,340.26 |
| Japan | 2024 | 7,781.15 | 47,479.84 |
| Jordan | 2024 | 1,961.50 | 10,468.27 |
| Kazakhstan | 2024 | 5,666.70 | 35,973.96 |
| Kenya | 2024 | 195.29 | 5,841.60 |
| Korea, Rep. | 2024 | 12,234.59 | 55,070.94 |
| Kuwait | 2024 | 16,626.02 | 46,664.22 |
| Kyrgyz Republic | 2024 | 2,167.58 | 7,210.58 |
| Lao PDR | 2024 | 1,502.48 | 8,600.32 |
| Latvia | 2024 | 3,767.70 | 37,615.08 |
| Lebanon | 2024 | 847.58 | 10,469.22 |
| Libya | 2024 | 5,155.92 | 12,583.83 |
| Lithuania | 2024 | 4,387.04 | 47,462.00 |
| Luxembourg | 2024 | 11,661.54 | 128,475.28 |
| Madagascar | 2024 | 76.74 | 1,659.15 |
| Malaysia | 2024 | 5,417.59 | 34,116.23 |
| Malta | 2024 | 5,138.46 | 62,398.49 |
| Mauritius | 2024 | 2,587.94 | 27,844.90 |
| Mexico | 2024 | 2,608.57 | 21,970.35 |
| Moldova | 2024 | 2,550.05 | 16,393.86 |
| Mongolia | 2024 | 2,968.97 | 16,842.65 |
| Montenegro | 2024 | 4,691.07 | 28,105.59 |
| Morocco | 2024 | 1,034.95 | 9,162.75 |
| Mozambique | 2024 | 389.61 | 1,500.71 |
| Myanmar | 2024 | 296.31 | 5,276.29 |
| Namibia | 2024 | 1,246.15 | 10,276.37 |
| Nepal | 2024 | 388.99 | 5,047.42 |
| Netherlands | 2024 | 6,386.37 | 70,493.91 |
| New Zealand | 2024 | 7,965.22 | 48,325.37 |
| Nicaragua | 2024 | 646.75 | 7,661.09 |
| Niger | 2024 | 64.26 | 1,795.65 |
| Nigeria | 2024 | 140.56 | 7,994.04 |
| North Macedonia | 2024 | 3,301.43 | 24,203.19 |
| Norway | 2024 | 23,673.08 | 94,803.67 |
| Oman | 2024 | 8,489.00 | 36,721.08 |
| Pakistan | 2024 | 493.47 | 5,502.07 |
| Panama | 2024 | 2,242.24 | 36,394.92 |
| Paraguay | 2024 | 2,849.27 | 16,367.49 |
| Peru | 2024 | 1,637.27 | 15,708.83 |
| Philippines | 2024 | 988.38 | 10,378.17 |
| Poland | 2024 | 4,532.81 | 45,153.04 |
| Portugal | 2024 | 5,293.85 | 42,228.16 |
| Qatar | 2024 | 19,312.96 | 111,314.25 |
| Romania | 2024 | 2,682.06 | 40,503.83 |
| Russian Federation | 2024 | 7,773.85 | 41,891.17 |
| Rwanda | 2024 | 79.26 | 3,325.01 |
| Saudi Arabia | 2024 | 11,808.35 | 63,194.43 |
| Senegal | 2024 | 419.31 | 4,477.82 |
| Serbia | 2024 | 5,165.74 | 26,900.74 |
| Singapore | 2024 | 9,946.73 | 134,548.76 |
| Slovak Republic | 2024 | 4,720.15 | 40,302.45 |
| Slovenia | 2024 | 6,449.66 | 48,658.03 |
| South Africa | 2024 | 3,308.19 | 13,597.65 |
| Spain | 2024 | 5,196.11 | 48,460.29 |
| Sri Lanka | 2024 | 695.11 | 13,793.07 |
| Sudan | 2024 | 191.76 | 1,861.40 |
| Suriname | 2024 | 2,919.15 | 19,179.10 |
| Sweden | 2024 | 12,251.99 | 62,558.41 |
| Switzerland | 2024 | 7,117.25 | 85,448.06 |
| Tajikistan | 2024 | 1,558.88 | 4,755.93 |
| Tanzania | 2024 | 171.40 | 3,713.26 |
| Thailand | 2024 | 3,080.43 | 21,882.21 |
| Togo | 2024 | 242.31 | 3,351.25 |
| Trinidad and Tobago | 2024 | 6,816.32 | 31,960.16 |
| Tunisia | 2024 | 1,570.16 | 12,774.92 |
| Turkiye | 2024 | 3,806.10 | 36,154.49 |
| Turkmenistan | 2024 | 3,397.29 | 18,470.74 |
| Uganda | 2024 | 98.67 | 2,879.67 |
| Ukraine | 2024 | 2,598.61 | 16,371.44 |
| United Arab Emirates | 2024 | 15,361.36 | 69,701.79 |
| United Kingdom | 2024 | 4,194.89 | 53,412.06 |
| United States | 2024 | 12,933.70 | 75,698.18 |
| Uruguay | 2024 | 4,013.18 | 32,149.48 |
| Uzbekistan | 2024 | 2,096.87 | 10,997.17 |
| Viet Nam | 2024 | 2,755.87 | 14,396.42 |
| Zambia | 2024 | 513.82 | 3,708.07 |
| Zimbabwe | 2024 | 552.71 | 5,211.90 |
Sources: World Bank / IEA electricity and World Bank real PPP income. Same-year observations; no interpolation.
Updated analysis · 9 November 2026. Snapshot 2026-11-09-fe53088a0f44. Data definitions & provenance
Association does not establish causation. Electricity consumption does not measure price, reliability, or access.
Original 2024 figure
This screenshot is preserved from the original article. Its underlying raw dataset is not available in the repository; it is not the dataset used by the updated interactive figure.

Economies with higher electricity consumption per person tend to have higher income per person. This association alone does not establish causation: electricity can enable production, while rising production also increases electricity demand. The chart measures consumption and income; it does not directly measure worker productivity, power reliability, or electricity prices.
2. Electricity consumption per capita vs GDP per Capita for selected countries
Highlight up to six economies. Missing years are not interpolated.
Static view · 2024 · snapshot 2026-11-09-24e8d6ada556. Scroll the static chart horizontally on narrow screens, or use the data table.
View the data table
| Economy | Year | Electricity consumption | Income per person |
|---|---|---|---|
| Brazil | 1990 | 1,459.39 | 12,633.29 |
| Brazil | 1991 | 1,485.48 | 12,546.56 |
| Brazil | 1992 | 1,493.91 | 12,271.98 |
| Brazil | 1993 | 1,538.13 | 12,669.43 |
| Brazil | 1994 | 1,568.41 | 13,202.93 |
| Brazil | 1995 | 1,637.28 | 13,550.44 |
| Brazil | 1996 | 1,691.32 | 13,641.63 |
| Brazil | 1997 | 1,768.2 | 13,896.62 |
| Brazil | 1998 | 1,815.03 | 13,737.7 |
| Brazil | 1999 | 1,839.61 | 13,602.41 |
| Brazil | 2000 | 1,905.77 | 14,005.35 |
| Brazil | 2001 | 1,756.81 | 14,016.13 |
| Brazil | 2002 | 1,817.14 | 14,265.9 |
| Brazil | 2003 | 1,894.63 | 14,259.37 |
| Brazil | 2004 | 1,970.42 | 14,911.26 |
| Brazil | 2005 | 2,031.51 | 15,221.01 |
| Brazil | 2006 | 2,089.17 | 15,657.48 |
| Brazil | 2007 | 2,185.75 | 16,440.58 |
| Brazil | 2008 | 2,249.33 | 17,113.37 |
| Brazil | 2009 | 2,217.79 | 16,939.44 |
| Brazil | 2010 | 2,398.61 | 18,062.16 |
| Brazil | 2011 | 2,458.56 | 18,627.81 |
| Brazil | 2012 | 2,530.98 | 18,832.22 |
| Brazil | 2013 | 2,600.67 | 19,241.51 |
| Brazil | 2014 | 2,690.21 | 19,183.17 |
| Brazil | 2015 | 2,628.1 | 18,357.07 |
| Brazil | 2016 | 2,592.61 | 17,620.93 |
| Brazil | 2017 | 2,610.17 | 17,724.48 |
| Brazil | 2018 | 2,640.42 | 17,917.75 |
| Brazil | 2019 | 2,661.18 | 18,018.62 |
| Brazil | 2020 | 2,624.91 | 17,327.52 |
| Brazil | 2021 | 2,723.97 | 18,075.71 |
| Brazil | 2022 | 2,787.76 | 18,554.05 |
| Brazil | 2023 | 2,916.49 | 19,079.81 |
| Brazil | 2024 | 3,068.1 | 19,652.37 |
| China | 1990 | 510.62 | 1,666.81 |
| China | 1991 | 548.95 | 1,798.38 |
| China | 1992 | 604.69 | 2,030.47 |
| China | 1993 | 662.64 | 2,286.8 |
| China | 1994 | 727.11 | 2,556.91 |
| China | 1995 | 770.28 | 2,807.89 |
| China | 1996 | 821.08 | 3,055.73 |
| China | 1997 | 852.74 | 3,305.83 |
| China | 1998 | 870.62 | 3,533.7 |
| China | 1999 | 913.96 | 3,774.43 |
| China | 2000 | 992.94 | 4,065.87 |
| China | 2001 | 1,076.55 | 4,372.44 |
| China | 2002 | 1,194.86 | 4,744.38 |
| China | 2003 | 1,379.48 | 5,191.78 |
| China | 2004 | 1,585.84 | 5,684.39 |
| China | 2005 | 1,782.31 | 6,298.3 |
| China | 2006 | 2,039.01 | 7,057.11 |
| China | 2007 | 2,325.93 | 8,013.78 |
| China | 2008 | 2,446.37 | 8,743.7 |
| China | 2009 | 2,612.46 | 9,518.68 |
| China | 2010 | 2,943.59 | 10,476.15 |
| China | 2011 | 3,295.78 | 11,404.92 |
| China | 2012 | 3,466.02 | 12,217.93 |
| China | 2013 | 3,757.19 | 13,080.88 |
| China | 2014 | 4,006.17 | 13,968.52 |
| China | 2015 | 4,017.08 | 14,857.11 |
| China | 2016 | 4,237.55 | 15,772.84 |
| China | 2017 | 4,571.04 | 16,758.05 |
| China | 2018 | 4,842.21 | 17,807.05 |
| China | 2019 | 5,082.39 | 18,820.59 |
| China | 2020 | 5,261.94 | 19,215.1 |
| China | 2021 | 5,847.8 | 20,843.3 |
| China | 2022 | 6,112.14 | 21,499.31 |
| China | 2023 | 6,585.67 | 22,687.25 |
| China | 2024 | 7,037.74 | 23,841.48 |
| Germany | 1990 | 6,639.73 | 42,355.29 |
| Germany | 1991 | 6,564.8 | 44,195.72 |
| Germany | 1992 | 6,445.87 | 44,744.14 |
| Germany | 1993 | 6,288.42 | 44,018.44 |
| Germany | 1994 | 6,244.96 | 45,005.16 |
| Germany | 1995 | 6,327.71 | 45,548.42 |
| Germany | 1996 | 6,403.33 | 45,888.13 |
| Germany | 1997 | 6,427.8 | 46,670.71 |
| Germany | 1998 | 6,479.49 | 47,641.53 |
| Germany | 1999 | 6,505.13 | 48,624.65 |
| Germany | 2000 | 6,635.42 | 49,955.65 |
| Germany | 2001 | 6,762.65 | 50,687.65 |
| Germany | 2002 | 6,900.78 | 50,487 |
| Germany | 2003 | 7,015.51 | 50,191.72 |
| Germany | 2004 | 7,116.23 | 50,786.02 |
| Germany | 2005 | 7,144.71 | 51,264.82 |
| Germany | 2006 | 7,219.99 | 53,307.16 |
| Germany | 2007 | 7,238.5 | 54,920.66 |
| Germany | 2008 | 7,197.69 | 55,513.76 |
| Germany | 2009 | 6,827.56 | 52,568.8 |
| Germany | 2010 | 7,266 | 54,826.26 |
| Germany | 2011 | 7,281.96 | 57,950.96 |
| Germany | 2012 | 7,251.53 | 58,110.38 |
| Germany | 2013 | 7,217.18 | 58,182.08 |
| Germany | 2014 | 7,035.62 | 59,203.23 |
| Germany | 2015 | 7,032.02 | 59,668.99 |
| Germany | 2016 | 6,972.37 | 60,504.59 |
| Germany | 2017 | 6,947.26 | 61,965.43 |
| Germany | 2018 | 6,815.82 | 62,481.12 |
| Germany | 2019 | 6,580.29 | 62,949.89 |
| Germany | 2020 | 6,367.11 | 60,299.58 |
| Germany | 2021 | 6,582.27 | 62,630.77 |
| Germany | 2022 | 6,316.26 | 63,777.93 |
| Germany | 2023 | 6,079.22 | 63,140.19 |
| Germany | 2024 | 6,156.68 | 62,654.6 |
| Kenya | 1990 | 127.99 | 4,177.49 |
| Kenya | 1991 | 129.45 | 4,102.48 |
| Kenya | 1992 | 129.56 | 3,946.84 |
| Kenya | 1993 | 132.3 | 3,844.92 |
| Kenya | 1994 | 129.79 | 3,833.22 |
| Kenya | 1995 | 132.1 | 3,890.1 |
| Kenya | 1996 | 134.65 | 3,941.41 |
| Kenya | 1997 | 132.02 | 3,853.37 |
| Kenya | 1998 | 132.96 | 3,871.82 |
| Kenya | 1999 | 122.59 | 3,848.46 |
| Kenya | 2000 | 109.06 | 3,756.64 |
| Kenya | 2001 | 118.06 | 3,778.26 |
| Kenya | 2002 | 117.71 | 3,681.26 |
| Kenya | 2003 | 125.82 | 3,674.09 |
| Kenya | 2004 | 130.96 | 3,743.57 |
| Kenya | 2005 | 131.02 | 3,844.74 |
| Kenya | 2006 | 133.32 | 3,970.73 |
| Kenya | 2007 | 140.6 | 4,116.45 |
| Kenya | 2008 | 141.33 | 4,002.88 |
| Kenya | 2009 | 140.84 | 4,012.19 |
| Kenya | 2010 | 146.4 | 4,211.52 |
| Kenya | 2011 | 152.93 | 4,307.11 |
| Kenya | 2012 | 149.9 | 4,387.94 |
| Kenya | 2013 | 159.4 | 4,443.37 |
| Kenya | 2014 | 165.75 | 4,558.55 |
| Kenya | 2015 | 172.17 | 4,679.62 |
| Kenya | 2016 | 173.27 | 4,770.31 |
| Kenya | 2017 | 175.6 | 4,846.86 |
| Kenya | 2018 | 178.14 | 5,017.67 |
| Kenya | 2019 | 175.81 | 5,171.71 |
| Kenya | 2020 | 172.64 | 5,057.4 |
| Kenya | 2021 | 184.43 | 5,338.85 |
| Kenya | 2022 | 189.36 | 5,491.69 |
| Kenya | 2023 | 190.08 | 5,691.83 |
| Kenya | 2024 | 195.29 | 5,841.6 |
| Luxembourg | 1990 | 13,667.67 | 81,455.03 |
| Luxembourg | 1991 | 14,087.86 | 87,318.5 |
| Luxembourg | 1992 | 12,927.9 | 87,734.2 |
| Luxembourg | 1993 | 12,632.24 | 90,200.6 |
| Luxembourg | 1994 | 13,665.07 | 92,380.42 |
| Luxembourg | 1995 | 14,920.77 | 92,396.4 |
| Luxembourg | 1996 | 14,629.73 | 92,421.58 |
| Luxembourg | 1997 | 15,134.1 | 96,216.9 |
| Luxembourg | 1998 | 15,460.32 | 101,369.82 |
| Luxembourg | 1999 | 14,990.42 | 108,186.85 |
| Luxembourg | 2000 | 15,663.53 | 114,148.35 |
| Luxembourg | 2001 | 15,620.86 | 116,265.23 |
| Luxembourg | 2002 | 15,984.76 | 118,764.33 |
| Luxembourg | 2003 | 16,261.1 | 120,403 |
| Luxembourg | 2004 | 16,300.11 | 123,725.76 |
| Luxembourg | 2005 | 15,635.55 | 124,871.95 |
| Luxembourg | 2006 | 16,452.37 | 130,290.17 |
| Luxembourg | 2007 | 16,348.16 | 138,683.32 |
| Luxembourg | 2008 | 15,933.69 | 135,814.61 |
| Luxembourg | 2009 | 14,423.96 | 129,004.51 |
| Luxembourg | 2010 | 16,808.26 | 131,434.36 |
| Luxembourg | 2011 | 15,497.34 | 129,887.63 |
| Luxembourg | 2012 | 14,639.91 | 128,897.4 |
| Luxembourg | 2013 | 14,134.28 | 129,947.34 |
| Luxembourg | 2014 | 13,851.76 | 130,249.55 |
| Luxembourg | 2015 | 14,410.01 | 130,097.34 |
| Luxembourg | 2016 | 14,327.83 | 133,661.73 |
| Luxembourg | 2017 | 13,847.9 | 132,169.83 |
| Luxembourg | 2018 | 13,497.82 | 131,733.88 |
| Luxembourg | 2019 | 12,309.66 | 132,724.75 |
| Luxembourg | 2020 | 11,980.92 | 129,865.63 |
| Luxembourg | 2021 | 12,151.91 | 136,772.44 |
| Luxembourg | 2022 | 11,676.57 | 132,570.83 |
| Luxembourg | 2023 | 11,447.56 | 130,048.92 |
| Luxembourg | 2024 | 11,661.54 | 128,475.28 |
| United States | 1990 | 11,713.33 | 44,384.21 |
| United States | 1991 | 12,134.17 | 43,747.63 |
| United States | 1992 | 12,014.96 | 44,664.87 |
| United States | 1993 | 12,261.52 | 45,292.74 |
| United States | 1994 | 12,455.16 | 46,543.32 |
| United States | 1995 | 12,659.61 | 47,227.01 |
| United States | 1996 | 12,854.3 | 48,441.91 |
| United States | 1997 | 12,889.83 | 49,990.67 |
| United States | 1998 | 13,154.76 | 51,626.48 |
| United States | 1999 | 13,281.87 | 53,480.9 |
| United States | 2000 | 13,671.05 | 55,045.67 |
| United States | 2001 | 13,046.61 | 55,024.35 |
| United States | 2002 | 13,296.18 | 55,443.22 |
| United States | 2003 | 13,307.49 | 56,505.45 |
| United States | 2004 | 13,388.59 | 58,139.08 |
| United States | 2005 | 13,704.58 | 59,612.39 |
| United States | 2006 | 13,583.27 | 60,684.34 |
| United States | 2007 | 13,657.45 | 61,314.45 |
| United States | 2008 | 13,663.43 | 60,806.22 |
| United States | 2009 | 12,913.71 | 58,722.5 |
| United States | 2010 | 13,382.07 | 59,797.07 |
| United States | 2011 | 13,250.2 | 60,253.2 |
| United States | 2012 | 12,964.35 | 61,142.36 |
| United States | 2013 | 12,971.63 | 61,966.66 |
| United States | 2014 | 12,999.17 | 63,026.88 |
| United States | 2015 | 12,860.19 | 64,367.72 |
| United States | 2016 | 12,784.71 | 65,025.99 |
| United States | 2017 | 12,600.1 | 66,164.03 |
| United States | 2018 | 13,020.26 | 67,728.44 |
| United States | 2019 | 12,765.81 | 69,121.46 |
| United States | 2020 | 12,385.18 | 67,406.83 |
| United States | 2021 | 12,676.19 | 71,441.23 |
| United States | 2022 | 12,968.99 | 72,828.74 |
| United States | 2023 | 12,710.84 | 74,351.67 |
| United States | 2024 | 12,933.7 | 75,698.18 |
Sources: World Bank / IEA Same-year observations; no interpolation. Real PPP income uses constant 2021 international dollars.
Updated analysis · 9 November 2026. Snapshot 2026-11-09-24e8d6ada556. Data definitions & provenance
Association does not establish causation.

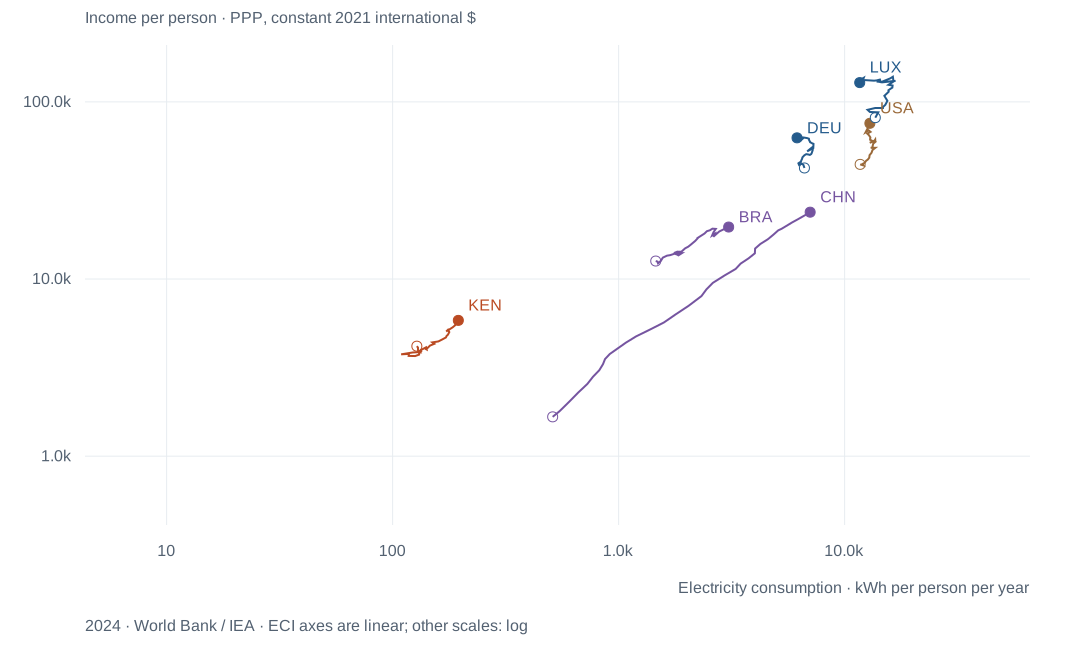
This next chart examines the relationship between electricity consumption and GDP per capita between selected countries. Three clear categories emerge.
-
Developing Economies: Represented by Kenya. These economies are struggling to improve their GDP per capita and their electricity consumption is also lagging. These nations have not made much progress in the last 30 years.
-
Rapidly Developing Economies: These are represented by China and Brazil. These countries are rapidly increasing their economic output, and their electricity consumption is matching this output. They are well on their way to becoming developed economies.
-
Mature Economies: Represented by Germany, USA and Luxembourg. These nations have high economic outputs and electrical consumption per capita however something interesting is observed here. At some point, these countries seem to be increasing their economic output while maintaining or even decreasing their electricity consumption! This is because as economies become mature they improve their efficiency and effectiveness such that they can produce more with less energy. This is the ultimate goal of every economy.
3. GDP per Capita vs Economic Complexity Index
Highlight up to six economies. Missing years are not interpolated.
Static view · 2024 · snapshot 2026-11-09-24e8d6ada556. Scroll the static chart horizontally on narrow screens, or use the data table.
View the data table
| Economy | Year | Economic complexity | Income per person |
|---|---|---|---|
| Afghanistan | 2024 | -0.81 | 1,964.45 |
| Albania | 2024 | 0.01 | 21,640.98 |
| Algeria | 2024 | -0.86 | 15,501.92 |
| American Samoa | 2024 | 0.87 | Unavailable |
| Andorra | 2024 | 1.17 | 66,232.74 |
| Angola | 2024 | -0.84 | 8,752.8 |
| Antigua and Barbuda | 2024 | 0.39 | 29,298.65 |
| Argentina | 2024 | -0.09 | 26,771.97 |
| Armenia | 2024 | 0.57 | 20,078.78 |
| Aruba | 2024 | 0.35 | 45,428 |
| Australia | 2024 | 0.1 | 60,309.58 |
| Austria | 2024 | 1.25 | 63,787.99 |
| Azerbaijan | 2024 | -0.42 | 22,090.53 |
| Bahamas, The | 2024 | 0.55 | 36,244.05 |
| Bahrain | 2024 | 0.65 | 59,060.18 |
| Bangladesh | 2024 | -0.47 | 8,486.78 |
| Barbados | 2024 | 0.43 | 21,557.53 |
| Belarus | 2024 | 0.74 | 29,135.95 |
| Belgium | 2024 | 0.96 | 63,311.28 |
| Belize | 2024 | -0.03 | 12,621.41 |
| Benin | 2024 | -1.01 | 3,901.33 |
| Bermuda | 2024 | 0.84 | 104,299.94 |
| Bhutan | 2024 | -0.39 | 15,603.89 |
| Bolivia | 2024 | -1.18 | 11,329.15 |
| Bosnia and Herzegovina | 2024 | 0.65 | 20,578.5 |
| Botswana | 2024 | -0.38 | 18,107.61 |
| Brazil | 2024 | 0.33 | 19,652.37 |
| British Virgin Islands | 2024 | 0.25 | Unavailable |
| Brunei Darussalam | 2024 | 0.32 | 79,071.73 |
| Bulgaria | 2024 | 0.77 | 34,221.39 |
| Burkina Faso | 2024 | -0.76 | 2,548.5 |
| Burundi | 2024 | -1.39 | 1,048.06 |
| Cabo Verde | 2024 | 0.25 | 9,825.53 |
| Cambodia | 2024 | -0 | 7,011.58 |
| Cameroon | 2024 | -1.62 | 4,916.93 |
| Canada | 2024 | 0.77 | 57,534.09 |
| Cayman Islands | 2024 | 0.37 | 80,996.65 |
| Central African Republic | 2024 | -0.34 | 1,111.22 |
| Chad | 2024 | -3.58 | 2,430.73 |
| Chile | 2024 | -0.08 | 30,267.64 |
| China | 2024 | 1.26 | 23,841.48 |
| Colombia | 2024 | 0.21 | 18,481.84 |
| Comoros | 2024 | -0.28 | 3,556.04 |
| Congo, Dem. Rep. | 2024 | -3.25 | 1,601.71 |
| Congo, Rep. | 2024 | -2.57 | 6,152.57 |
| Costa Rica | 2024 | 0.32 | 27,325.05 |
| Cote d'Ivoire | 2024 | -1 | 6,747.04 |
| Croatia | 2024 | 0.81 | 42,828.8 |
| Cuba | 2024 | -1.09 | Unavailable |
| Curacao | 2024 | 0.89 | 28,762.06 |
| Cyprus | 2024 | 0.49 | 52,861.84 |
| Czechia | 2024 | 1.32 | 47,972.53 |
| Denmark | 2024 | 1 | 71,034.58 |
| Djibouti | 2024 | -0.74 | 6,871.12 |
| Dominica | 2024 | 0.18 | 18,739.36 |
| Dominican Republic | 2024 | 0.01 | 24,229.89 |
| Ecuador | 2024 | -0.86 | 13,922.42 |
| Egypt, Arab Rep. | 2024 | 0.05 | 16,798.15 |
| El Salvador | 2024 | 0.27 | 11,647.02 |
| Equatorial Guinea | 2024 | -2.68 | 14,997.76 |
| Eritrea | 2024 | -1.04 | Unavailable |
| Estonia | 2024 | 0.88 | 41,185.83 |
| Eswatini | 2024 | 0.25 | 10,386.21 |
| Ethiopia | 2024 | -1.14 | 2,892.22 |
| Faroe Islands | 2024 | -0.12 | 72,113.65 |
| Fiji | 2024 | -0.05 | 13,592.46 |
| Finland | 2024 | 1.14 | 55,901.32 |
| France | 2024 | 1.08 | 54,799.35 |
| French Polynesia | 2024 | 0.33 | Unavailable |
| Gabon | 2024 | -1.81 | 18,923.66 |
| Gambia, The | 2024 | -1.32 | 3,057.68 |
| Georgia | 2024 | 0.2 | 24,146.62 |
| Germany | 2024 | 1.36 | 62,654.6 |
| Ghana | 2024 | -0.64 | 7,072.8 |
| Gibraltar | 2024 | 0.87 | Unavailable |
| Greece | 2024 | 0.51 | 37,474.28 |
| Greenland | 2024 | -0.39 | Unavailable |
| Grenada | 2024 | 0.34 | 17,484.52 |
| Guam | 2024 | 0.01 | Unavailable |
| Guatemala | 2024 | 0.03 | 12,643.98 |
| Guinea | 2024 | -1.79 | 4,016.34 |
| Guinea-Bissau | 2024 | -1.55 | 2,717.54 |
| Guyana | 2024 | -0.54 | 70,516.7 |
| Haiti | 2024 | -0.56 | 2,783.79 |
| Honduras | 2024 | -0.32 | 6,590.84 |
| Hong Kong SAR, China | 2024 | 1.2 | 66,186.04 |
| Hungary | 2024 | 1.13 | 40,747.2 |
| Iceland | 2024 | 0.46 | 68,230.36 |
| India | 2024 | 0.69 | 9,416.05 |
| Indonesia | 2024 | 0.21 | 14,470.72 |
| Iran, Islamic Rep. | 2024 | -0.08 | 17,484.13 |
| Iraq | 2024 | -1.34 | 12,725.04 |
| Ireland | 2024 | 1.19 | 118,833.31 |
| Israel | 2024 | 1.34 | 47,388.72 |
| Italy | 2024 | 1.11 | 53,284.87 |
| Jamaica | 2024 | -0.28 | 11,340.26 |
| Japan | 2024 | 1.74 | 47,479.84 |
| Jordan | 2024 | 0.2 | 10,468.27 |
| Kazakhstan | 2024 | 0.33 | 35,973.96 |
| Kenya | 2024 | -0.31 | 5,841.6 |
| Kiribati | 2024 | -0.59 | 3,275 |
| Korea, Dem. People's Rep. | 2024 | 0.92 | Unavailable |
| Korea, Rep. | 2024 | 1.61 | 55,070.94 |
| Kosovo | 2024 | Unavailable | 15,716.29 |
| Kuwait | 2024 | 0.33 | 46,664.22 |
| Kyrgyz Republic | 2024 | 0.17 | 7,210.58 |
| Lao PDR | 2024 | -0.75 | 8,600.32 |
| Latvia | 2024 | 0.72 | 37,615.08 |
| Lebanon | 2024 | 0.37 | 10,469.22 |
| Lesotho | 2024 | -0.52 | 2,697.63 |
| Liberia | 2024 | -2.29 | 1,646.06 |
| Libya | 2024 | -1.46 | 12,583.83 |
| Lithuania | 2024 | 0.82 | 47,462 |
| Luxembourg | 2024 | 1.08 | 128,475.28 |
| Macao SAR, China | 2024 | 0.71 | 111,693.5 |
| Madagascar | 2024 | -1.08 | 1,659.15 |
| Malawi | 2024 | -1.05 | 1,634.25 |
| Malaysia | 2024 | 0.86 | 34,116.23 |
| Maldives | 2024 | -0.54 | 23,034.41 |
| Mali | 2024 | -0.89 | 2,917.93 |
| Malta | 2024 | 1.03 | 62,398.49 |
| Marshall Islands | 2024 | -0.11 | 7,236.87 |
| Mauritania | 2024 | -1.23 | 6,482.69 |
| Mauritius | 2024 | 0.26 | 27,844.9 |
| Mexico | 2024 | 0.94 | 21,970.35 |
| Micronesia, Fed. Sts. | 2024 | -0.27 | 3,911.27 |
| Moldova | 2024 | 0.17 | 16,393.86 |
| Mongolia | 2024 | -1.68 | 16,842.65 |
| Montenegro | 2024 | 0.33 | 28,105.59 |
| Morocco | 2024 | -0.07 | 9,162.75 |
| Mozambique | 2024 | -1.28 | 1,500.71 |
| Myanmar | 2024 | -0.98 | 5,276.29 |
| Namibia | 2024 | -0.57 | 10,276.37 |
| Naoero | 2024 | 0.86 | 11,957.88 |
| Nepal | 2024 | -0.1 | 5,047.42 |
| Netherlands | 2024 | 0.94 | 70,493.91 |
| New Caledonia | 2024 | -0.45 | Unavailable |
| New Zealand | 2024 | 0.51 | 48,325.37 |
| Nicaragua | 2024 | -0.94 | 7,661.09 |
| Niger | 2024 | -0.83 | 1,795.65 |
| Nigeria | 2024 | -2.31 | 7,994.04 |
| North Macedonia | 2024 | 0.39 | 24,203.19 |
| Northern Mariana Islands | 2024 | 0.65 | Unavailable |
| Norway | 2024 | 0.72 | 94,803.67 |
| Oman | 2024 | -0.14 | 36,721.08 |
| Pakistan | 2024 | -0.27 | 5,502.07 |
| Palau | 2024 | -0.43 | 18,499.99 |
| Panama | 2024 | 0.39 | 36,394.92 |
| Papua New Guinea | 2024 | -2.16 | 4,292.71 |
| Paraguay | 2024 | -0.32 | 16,367.49 |
| Peru | 2024 | -0.63 | 15,708.83 |
| Philippines | 2024 | 0.75 | 10,378.17 |
| Poland | 2024 | 0.97 | 45,153.04 |
| Portugal | 2024 | 0.7 | 42,228.16 |
| Puerto Rico (US) | 2024 | Unavailable | 44,216.43 |
| Qatar | 2024 | 0.32 | 111,314.25 |
| Romania | 2024 | 0.98 | 40,503.83 |
| Russian Federation | 2024 | 0.23 | 41,891.17 |
| Rwanda | 2024 | -1.12 | 3,325.01 |
| Samoa | 2024 | 0.34 | 7,687.23 |
| San Marino | 2024 | 1.13 | Unavailable |
| Sao Tome and Principe | 2024 | 0.34 | 5,511.88 |
| Saudi Arabia | 2024 | 0.54 | 63,194.43 |
| Senegal | 2024 | -0.54 | 4,477.82 |
| Serbia | 2024 | 0.75 | 26,900.74 |
| Seychelles | 2024 | 0.17 | 29,288.02 |
| Sierra Leone | 2024 | -0.29 | 3,098.76 |
| Singapore | 2024 | 1.54 | 134,548.76 |
| Sint Maarten (Dutch part) | 2024 | 0.78 | 47,303.19 |
| Slovak Republic | 2024 | 1.11 | 40,302.45 |
| Slovenia | 2024 | 1.28 | 48,658.03 |
| Solomon Islands | 2024 | -2.07 | 2,353.55 |
| Somalia, Fed. Rep. | 2024 | -1.66 | 1,409.33 |
| South Africa | 2024 | 0.35 | 13,597.65 |
| South Sudan | 2024 | -1.37 | Unavailable |
| Spain | 2024 | 0.8 | 48,460.29 |
| Sri Lanka | 2024 | -0.06 | 13,793.07 |
| St. Kitts and Nevis | 2024 | 0.69 | 30,656.44 |
| St. Lucia | 2024 | -0.16 | 24,699.97 |
| St. Vincent and the Grenadines | 2024 | -0.4 | 18,714.2 |
| Sudan | 2024 | -2.07 | 1,861.4 |
| Suriname | 2024 | 0.16 | 19,179.1 |
| Sweden | 2024 | 1.23 | 62,558.41 |
| Switzerland | 2024 | 1.59 | 85,448.06 |
| Syrian Arab Republic | 2024 | -0.41 | Unavailable |
| Tajikistan | 2024 | -1.45 | 4,755.93 |
| Tanzania | 2024 | -0.99 | 3,713.26 |
| Thailand | 2024 | 0.81 | 21,882.21 |
| Timor-Leste | 2024 | -0.7 | 3,890.96 |
| Togo | 2024 | -0.68 | 3,351.25 |
| Tonga | 2024 | -0.13 | 7,180.99 |
| Trinidad and Tobago | 2024 | 0.06 | 31,960.16 |
| Tunisia | 2024 | 0.58 | 12,774.92 |
| Turkiye | 2024 | 0.68 | 36,154.49 |
| Turkmenistan | 2024 | -1.2 | 18,470.74 |
| Turks and Caicos Islands | 2024 | 0.57 | 33,390.53 |
| Tuvalu | 2024 | -0.03 | 5,592.19 |
| Uganda | 2024 | -0.57 | 2,879.67 |
| Ukraine | 2024 | 0.33 | 16,371.44 |
| United Arab Emirates | 2024 | 0.45 | 69,701.79 |
| United Kingdom | 2024 | 1.25 | 53,412.06 |
| United States | 2024 | 1.12 | 75,698.18 |
| Uruguay | 2024 | 0.09 | 32,149.48 |
| Uzbekistan | 2024 | 0.2 | 10,997.17 |
| Vanuatu | 2024 | -1.66 | 3,837.04 |
| Venezuela, RB | 2024 | -1.6 | Unavailable |
| Viet Nam | 2024 | 0.67 | 14,396.42 |
| West Bank and Gaza | 2024 | -0.23 | 4,190.91 |
| Yemen, Rep. | 2024 | -1.15 | Unavailable |
| Zambia | 2024 | -0.73 | 3,708.07 |
| Zimbabwe | 2024 | -1.14 | 5,211.9 |
Sources: World Bank / Harvard Growth Lab Same-year observations; no interpolation. ECI uses the HS92 goods classification.
Updated analysis · 9 November 2026. Snapshot 2026-11-09-24e8d6ada556. Data definitions & provenance
Association does not establish causation. ECI describes the complexity of goods exports, not every activity in an economy.

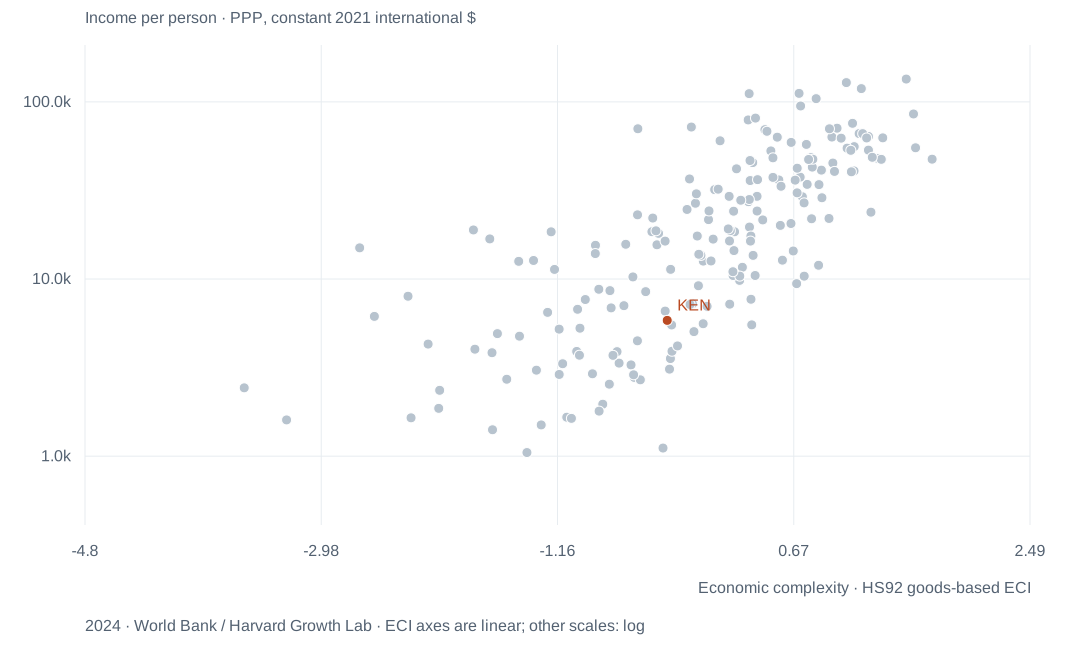
From the above chart, there is another strong positive correlation between GDP per capita and economic complexity. There are some exceptions like Qatar, the UAE, Kuwait, etc. These can be explained by the presence of oil deposits that these countries export thus they do not need to have complex economies to have a high GDP per capita. However, their goal should be to invest their income in creating a sufficiently advanced and complex economy to buffer themselves against upsets in their major export. Suppose a new source of energy is discovered or invented that will replace oil. Or perhaps their deposits run out? What then? To flourish a nation needs to generate wealth consistently, and the way to create more is through innovation. Innovation is essential to African stability and growth in the upcoming decades. Currently, much of that wealth creation is the creation of microenterprises, small businesses that only employ one or two people9.
4. Number of Scientific Publications per Country
Highlight up to six economies. Missing years are not interpolated.
Static view · 2023 · snapshot 2026-11-09-24e8d6ada556. Scroll the static chart horizontally on narrow screens, or use the data table.
View the data table
| Economy | Year | Year | Scientific output |
|---|---|---|---|
| Brazil | 1996 | 1,996 | 46.56 |
| Brazil | 1997 | 1,997 | 55.82 |
| Brazil | 1998 | 1,998 | 62.06 |
| Brazil | 1999 | 1,999 | 66.56 |
| Brazil | 2000 | 2,000 | 73.56 |
| Brazil | 2001 | 2,001 | 78.93 |
| Brazil | 2002 | 2,002 | 88.6 |
| Brazil | 2003 | 2,003 | 95.8 |
| Brazil | 2004 | 2,004 | 106.09 |
| Brazil | 2005 | 2,005 | 117.77 |
| Brazil | 2006 | 2,006 | 143.41 |
| Brazil | 2007 | 2,007 | 152.36 |
| Brazil | 2008 | 2,008 | 171.91 |
| Brazil | 2009 | 2,009 | 184.23 |
| Brazil | 2010 | 2,010 | 197.06 |
| Brazil | 2011 | 2,011 | 206.45 |
| Brazil | 2012 | 2,012 | 224.99 |
| Brazil | 2013 | 2,013 | 231.72 |
| Brazil | 2014 | 2,014 | 240.84 |
| Brazil | 2015 | 2,015 | 244.66 |
| Brazil | 2016 | 2,016 | 254.63 |
| Brazil | 2017 | 2,017 | 268.92 |
| Brazil | 2018 | 2,018 | 285.65 |
| Brazil | 2019 | 2,019 | 301.66 |
| Brazil | 2020 | 2,020 | 320.62 |
| Brazil | 2021 | 2,021 | 332.1 |
| Brazil | 2022 | 2,022 | 297.95 |
| Brazil | 2023 | 2,023 | 276.08 |
| China | 1996 | 1,996 | 27.61 |
| China | 1997 | 1,997 | 30.42 |
| China | 1998 | 1,998 | 35.25 |
| China | 1999 | 1,999 | 36.07 |
| China | 2000 | 2,000 | 42.2 |
| China | 2001 | 2,001 | 55.57 |
| China | 2002 | 2,002 | 58.53 |
| China | 2003 | 2,003 | 67.98 |
| China | 2004 | 2,004 | 93.29 |
| China | 2005 | 2,005 | 126.76 |
| China | 2006 | 2,006 | 146.47 |
| China | 2007 | 2,007 | 161.59 |
| China | 2008 | 2,008 | 186.44 |
| China | 2009 | 2,009 | 213.69 |
| China | 2010 | 2,010 | 230.13 |
| China | 2011 | 2,011 | 238.63 |
| China | 2012 | 2,012 | 241.03 |
| China | 2013 | 2,013 | 257.86 |
| China | 2014 | 2,014 | 276.61 |
| China | 2015 | 2,015 | 290.71 |
| China | 2016 | 2,016 | 310.1 |
| China | 2017 | 2,017 | 332.44 |
| China | 2018 | 2,018 | 366.12 |
| China | 2019 | 2,019 | 432.34 |
| China | 2020 | 2,020 | 476.03 |
| China | 2021 | 2,021 | 535.42 |
| China | 2022 | 2,022 | 627.37 |
| China | 2023 | 2,023 | 661.16 |
| Germany | 1996 | 1,996 | 784.11 |
| Germany | 1997 | 1,997 | 832.27 |
| Germany | 1998 | 1,998 | 846.44 |
| Germany | 1999 | 1,999 | 822.58 |
| Germany | 2000 | 2,000 | 848.28 |
| Germany | 2001 | 2,001 | 868.62 |
| Germany | 2002 | 2,002 | 864.65 |
| Germany | 2003 | 2,003 | 880.93 |
| Germany | 2004 | 2,004 | 913.27 |
| Germany | 2005 | 2,005 | 1,014.74 |
| Germany | 2006 | 2,006 | 1,038.61 |
| Germany | 2007 | 2,007 | 1,074.9 |
| Germany | 2008 | 2,008 | 1,110.04 |
| Germany | 2009 | 2,009 | 1,149.94 |
| Germany | 2010 | 2,010 | 1,175.5 |
| Germany | 2011 | 2,011 | 1,236.16 |
| Germany | 2012 | 2,012 | 1,290.15 |
| Germany | 2013 | 2,013 | 1,294.51 |
| Germany | 2014 | 2,014 | 1,303.14 |
| Germany | 2015 | 2,015 | 1,307.15 |
| Germany | 2016 | 2,016 | 1,322.87 |
| Germany | 2017 | 2,017 | 1,328.08 |
| Germany | 2018 | 2,018 | 1,316.07 |
| Germany | 2019 | 2,019 | 1,328.41 |
| Germany | 2020 | 2,020 | 1,313.09 |
| Germany | 2021 | 2,021 | 1,407.85 |
| Germany | 2022 | 2,022 | 1,350.13 |
| Germany | 2023 | 2,023 | 1,306.11 |
| India | 1996 | 1,996 | 19.3 |
| India | 1997 | 1,997 | 19.37 |
| India | 1998 | 1,998 | 19.36 |
| India | 1999 | 1,999 | 20.07 |
| India | 2000 | 2,000 | 20.24 |
| India | 2001 | 2,001 | 20.9 |
| India | 2002 | 2,002 | 21.59 |
| India | 2003 | 2,003 | 23.39 |
| India | 2004 | 2,004 | 24.68 |
| India | 2005 | 2,005 | 27.83 |
| India | 2006 | 2,006 | 31.57 |
| India | 2007 | 2,007 | 34.69 |
| India | 2008 | 2,008 | 38.5 |
| India | 2009 | 2,009 | 42.31 |
| India | 2010 | 2,010 | 46.88 |
| India | 2011 | 2,011 | 54.75 |
| India | 2012 | 2,012 | 59.09 |
| India | 2013 | 2,013 | 61.89 |
| India | 2014 | 2,014 | 67.3 |
| India | 2015 | 2,015 | 71.38 |
| India | 2016 | 2,016 | 77.93 |
| India | 2017 | 2,017 | 84.61 |
| India | 2018 | 2,018 | 89.52 |
| India | 2019 | 2,019 | 92.57 |
| India | 2020 | 2,020 | 103.89 |
| India | 2021 | 2,021 | 122.4 |
| India | 2022 | 2,022 | 140.65 |
| India | 2023 | 2,023 | 158.67 |
| Kenya | 1996 | 1,996 | 14.35 |
| Kenya | 1997 | 1,997 | 14.56 |
| Kenya | 1998 | 1,998 | 12.48 |
| Kenya | 1999 | 1,999 | 12.18 |
| Kenya | 2000 | 2,000 | 11.75 |
| Kenya | 2001 | 2,001 | 12.81 |
| Kenya | 2002 | 2,002 | 13.44 |
| Kenya | 2003 | 2,003 | 12.5 |
| Kenya | 2004 | 2,004 | 12.86 |
| Kenya | 2005 | 2,005 | 12.8 |
| Kenya | 2006 | 2,006 | 12.8 |
| Kenya | 2007 | 2,007 | 13.97 |
| Kenya | 2008 | 2,008 | 14.37 |
| Kenya | 2009 | 2,009 | 16.9 |
| Kenya | 2010 | 2,010 | 17.62 |
| Kenya | 2011 | 2,011 | 18.86 |
| Kenya | 2012 | 2,012 | 17.47 |
| Kenya | 2013 | 2,013 | 18.51 |
| Kenya | 2014 | 2,014 | 19.99 |
| Kenya | 2015 | 2,015 | 20.74 |
| Kenya | 2016 | 2,016 | 22.32 |
| Kenya | 2017 | 2,017 | 23.74 |
| Kenya | 2018 | 2,018 | 25.94 |
| Kenya | 2019 | 2,019 | 28.27 |
| Kenya | 2020 | 2,020 | 34.24 |
| Kenya | 2021 | 2,021 | 37.43 |
| Kenya | 2022 | 2,022 | 37.81 |
| Kenya | 2023 | 2,023 | 37.57 |
| United States | 1996 | 1,996 | 1,163.32 |
| United States | 1997 | 1,997 | 1,141.06 |
| United States | 1998 | 1,998 | 1,096.96 |
| United States | 1999 | 1,999 | 1,064.15 |
| United States | 2000 | 2,000 | 1,086.16 |
| United States | 2001 | 2,001 | 1,076.38 |
| United States | 2002 | 2,002 | 1,118.2 |
| United States | 2003 | 2,003 | 1,146.25 |
| United States | 2004 | 2,004 | 1,216.46 |
| United States | 2005 | 2,005 | 1,302.84 |
| United States | 2006 | 2,006 | 1,299.71 |
| United States | 2007 | 2,007 | 1,295.47 |
| United States | 2008 | 2,008 | 1,290.95 |
| United States | 2009 | 2,009 | 1,296.7 |
| United States | 2010 | 2,010 | 1,316.85 |
| United States | 2011 | 2,011 | 1,348.17 |
| United States | 2012 | 2,012 | 1,352.6 |
| United States | 2013 | 2,013 | 1,349.34 |
| United States | 2014 | 2,014 | 1,340.67 |
| United States | 2015 | 2,015 | 1,333.87 |
| United States | 2016 | 2,016 | 1,331.29 |
| United States | 2017 | 2,017 | 1,333.02 |
| United States | 2018 | 2,018 | 1,342.65 |
| United States | 2019 | 2,019 | 1,340.47 |
| United States | 2020 | 2,020 | 1,368.88 |
| United States | 2021 | 2,021 | 1,419.39 |
| United States | 2022 | 2,022 | 1,339.95 |
| United States | 2023 | 2,023 | 1,279.4 |
Sources: World Bank / NSF Same-year observations; no interpolation. Fractional counts are preserved; population adjustment uses the same observation year.
Updated analysis · 9 November 2026. Snapshot 2026-11-09-24e8d6ada556. Data definitions & provenance
Association does not establish causation. Publication counts measure output, not research quality.

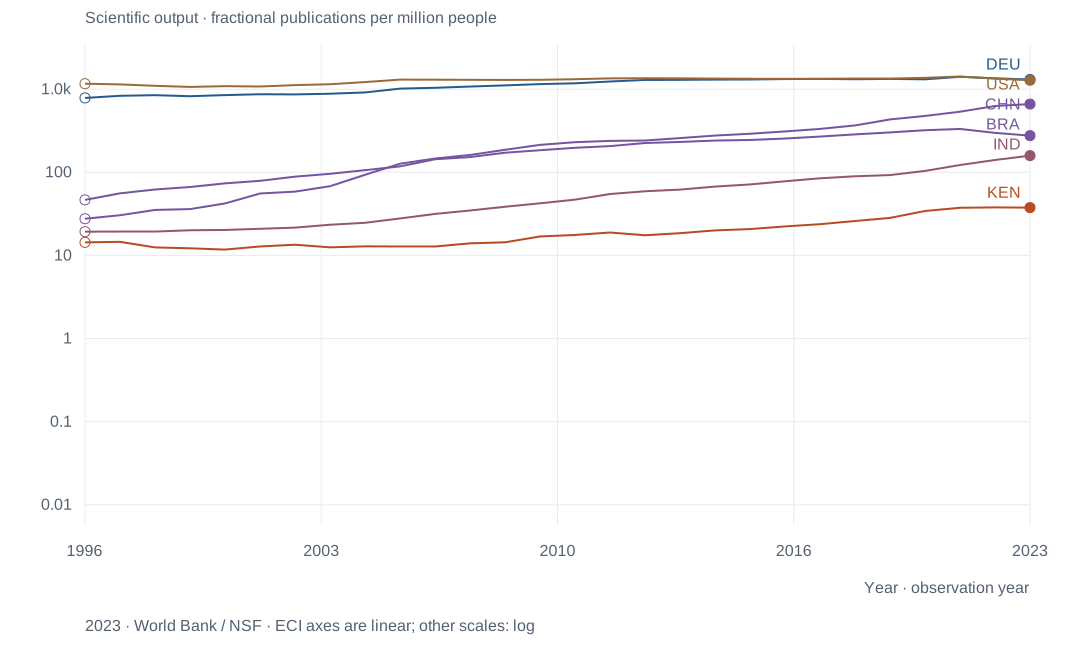
This chart shows the number of scientific publications per country (for the selected countries) per year from 2000 to 2018. The notable development here is the meteoric rise of scientific publications in China, which is in tandem with its economic growth. India and Brazil, other rapidly developing nations, are also following the Chinese path of investing in research and development as their engine for economic growth.
5. Electricity Consumption per Capita vs Economic Complexity Index
Highlight up to six economies. Missing years are not interpolated.
Static view · 2024 · snapshot 2026-11-09-24e8d6ada556. Scroll the static chart horizontally on narrow screens, or use the data table.
View the data table
| Economy | Year | Electricity consumption | Economic complexity |
|---|---|---|---|
| Afghanistan | 2024 | Unavailable | -0.81 |
| Albania | 2024 | 2,986.38 | 0.01 |
| Algeria | 2024 | 1,917.94 | -0.86 |
| American Samoa | 2024 | Unavailable | 0.87 |
| Andorra | 2024 | Unavailable | 1.17 |
| Angola | 2024 | 353.46 | -0.84 |
| Antigua and Barbuda | 2024 | Unavailable | 0.39 |
| Argentina | 2024 | 2,822.1 | -0.09 |
| Armenia | 2024 | 2,477.67 | 0.57 |
| Aruba | 2024 | Unavailable | 0.35 |
| Australia | 2024 | 9,793.56 | 0.1 |
| Austria | 2024 | 7,896.83 | 1.25 |
| Azerbaijan | 2024 | 2,443.83 | -0.42 |
| Bahamas, The | 2024 | Unavailable | 0.55 |
| Bahrain | 2024 | 23,845.73 | 0.65 |
| Bangladesh | 2024 | 632.1 | -0.47 |
| Barbados | 2024 | Unavailable | 0.43 |
| Belarus | 2024 | 4,415.27 | 0.74 |
| Belgium | 2024 | 7,098.81 | 0.96 |
| Belize | 2024 | Unavailable | -0.03 |
| Benin | 2024 | 122.66 | -1.01 |
| Bermuda | 2024 | Unavailable | 0.84 |
| Bhutan | 2024 | Unavailable | -0.39 |
| Bolivia | 2024 | 911.28 | -1.18 |
| Bosnia and Herzegovina | 2024 | 3,859.68 | 0.65 |
| Botswana | 2024 | 1,660.36 | -0.38 |
| Brazil | 2024 | 3,068.1 | 0.33 |
| British Virgin Islands | 2024 | Unavailable | 0.25 |
| Brunei Darussalam | 2024 | 10,963.41 | 0.32 |
| Bulgaria | 2024 | 5,469.91 | 0.77 |
| Burkina Faso | 2024 | 145.44 | -0.76 |
| Burundi | 2024 | Unavailable | -1.39 |
| Cabo Verde | 2024 | Unavailable | 0.25 |
| Cambodia | 2024 | 1,086.24 | -0 |
| Cameroon | 2024 | 202.31 | -1.62 |
| Canada | 2024 | 14,260.13 | 0.77 |
| Cayman Islands | 2024 | Unavailable | 0.37 |
| Central African Republic | 2024 | Unavailable | -0.34 |
| Chad | 2024 | 12.71 | -3.58 |
| Chile | 2024 | 4,392.97 | -0.08 |
| China | 2024 | 7,037.74 | 1.26 |
| Colombia | 2024 | 1,545.96 | 0.21 |
| Comoros | 2024 | Unavailable | -0.28 |
| Congo, Dem. Rep. | 2024 | 126.98 | -3.25 |
| Congo, Rep. | 2024 | 270.96 | -2.57 |
| Costa Rica | 2024 | 2,350.14 | 0.32 |
| Cote d'Ivoire | 2024 | 365.94 | -1 |
| Croatia | 2024 | 4,630.39 | 0.81 |
| Cuba | 2024 | 1,372.98 | -1.09 |
| Curacao | 2024 | 5,610.16 | 0.89 |
| Cyprus | 2024 | 4,070.58 | 0.49 |
| Czechia | 2024 | 5,876.92 | 1.32 |
| Denmark | 2024 | 6,143.89 | 1 |
| Djibouti | 2024 | Unavailable | -0.74 |
| Dominica | 2024 | Unavailable | 0.18 |
| Dominican Republic | 2024 | 2,033.51 | 0.01 |
| Ecuador | 2024 | 1,639.38 | -0.86 |
| Egypt, Arab Rep. | 2024 | 1,555.44 | 0.05 |
| El Salvador | 2024 | 1,207.92 | 0.27 |
| Equatorial Guinea | 2024 | 854.95 | -2.68 |
| Eritrea | 2024 | 127.56 | -1.04 |
| Estonia | 2024 | 5,932.93 | 0.88 |
| Eswatini | 2024 | 1,101.53 | 0.25 |
| Ethiopia | 2024 | 157.38 | -1.14 |
| Faroe Islands | 2024 | Unavailable | -0.12 |
| Fiji | 2024 | Unavailable | -0.05 |
| Finland | 2024 | 14,819.27 | 1.14 |
| France | 2024 | 6,443.05 | 1.08 |
| French Polynesia | 2024 | Unavailable | 0.33 |
| Gabon | 2024 | 1,015.77 | -1.81 |
| Gambia, The | 2024 | Unavailable | -1.32 |
| Georgia | 2024 | 3,485.89 | 0.2 |
| Germany | 2024 | 6,156.68 | 1.36 |
| Ghana | 2024 | 597.9 | -0.64 |
| Gibraltar | 2024 | 5,009.03 | 0.87 |
| Greece | 2024 | 4,988.6 | 0.51 |
| Greenland | 2024 | Unavailable | -0.39 |
| Grenada | 2024 | Unavailable | 0.34 |
| Guam | 2024 | Unavailable | 0.01 |
| Guatemala | 2024 | 743.33 | 0.03 |
| Guinea | 2024 | Unavailable | -1.79 |
| Guinea-Bissau | 2024 | Unavailable | -1.55 |
| Guyana | 2024 | Unavailable | -0.54 |
| Haiti | 2024 | 63.45 | -0.56 |
| Honduras | 2024 | 816.3 | -0.32 |
| Hong Kong SAR, China | 2024 | 6,311.32 | 1.2 |
| Hungary | 2024 | 4,812.45 | 1.13 |
| Iceland | 2024 | 49,241.15 | 0.46 |
| India | 2024 | 1,222.83 | 0.69 |
| Indonesia | 2024 | 1,611.12 | 0.21 |
| Iran, Islamic Rep. | 2024 | 3,910.49 | -0.08 |
| Iraq | 2024 | 1,755.7 | -1.34 |
| Ireland | 2024 | 6,298.24 | 1.19 |
| Israel | 2024 | 6,900.58 | 1.34 |
| Italy | 2024 | 5,136.68 | 1.11 |
| Jamaica | 2024 | 1,202.11 | -0.28 |
| Japan | 2024 | 7,781.15 | 1.74 |
| Jordan | 2024 | 1,961.5 | 0.2 |
| Kazakhstan | 2024 | 5,666.7 | 0.33 |
| Kenya | 2024 | 195.29 | -0.31 |
| Kiribati | 2024 | Unavailable | -0.59 |
| Korea, Dem. People's Rep. | 2024 | 793.58 | 0.92 |
| Korea, Rep. | 2024 | 12,234.59 | 1.61 |
| Kuwait | 2024 | 16,626.02 | 0.33 |
| Kyrgyz Republic | 2024 | 2,167.58 | 0.17 |
| Lao PDR | 2024 | 1,502.48 | -0.75 |
| Latvia | 2024 | 3,767.7 | 0.72 |
| Lebanon | 2024 | 847.58 | 0.37 |
| Lesotho | 2024 | Unavailable | -0.52 |
| Liberia | 2024 | Unavailable | -2.29 |
| Libya | 2024 | 5,155.92 | -1.46 |
| Lithuania | 2024 | 4,387.04 | 0.82 |
| Luxembourg | 2024 | 11,661.54 | 1.08 |
| Macao SAR, China | 2024 | Unavailable | 0.71 |
| Madagascar | 2024 | 76.74 | -1.08 |
| Malawi | 2024 | Unavailable | -1.05 |
| Malaysia | 2024 | 5,417.59 | 0.86 |
| Maldives | 2024 | Unavailable | -0.54 |
| Mali | 2024 | Unavailable | -0.89 |
| Malta | 2024 | 5,138.46 | 1.03 |
| Marshall Islands | 2024 | Unavailable | -0.11 |
| Mauritania | 2024 | Unavailable | -1.23 |
| Mauritius | 2024 | 2,587.94 | 0.26 |
| Mexico | 2024 | 2,608.57 | 0.94 |
| Micronesia, Fed. Sts. | 2024 | Unavailable | -0.27 |
| Moldova | 2024 | 2,550.05 | 0.17 |
| Mongolia | 2024 | 2,968.97 | -1.68 |
| Montenegro | 2024 | 4,691.07 | 0.33 |
| Morocco | 2024 | 1,034.95 | -0.07 |
| Mozambique | 2024 | 389.61 | -1.28 |
| Myanmar | 2024 | 296.31 | -0.98 |
| Namibia | 2024 | 1,246.15 | -0.57 |
| Naoero | 2024 | Unavailable | 0.86 |
| Nepal | 2024 | 388.99 | -0.1 |
| Netherlands | 2024 | 6,386.37 | 0.94 |
| New Caledonia | 2024 | Unavailable | -0.45 |
| New Zealand | 2024 | 7,965.22 | 0.51 |
| Nicaragua | 2024 | 646.75 | -0.94 |
| Niger | 2024 | 64.26 | -0.83 |
| Nigeria | 2024 | 140.56 | -2.31 |
| North Macedonia | 2024 | 3,301.43 | 0.39 |
| Northern Mariana Islands | 2024 | Unavailable | 0.65 |
| Norway | 2024 | 23,673.08 | 0.72 |
| Oman | 2024 | 8,489 | -0.14 |
| Pakistan | 2024 | 493.47 | -0.27 |
| Palau | 2024 | Unavailable | -0.43 |
| Panama | 2024 | 2,242.24 | 0.39 |
| Papua New Guinea | 2024 | Unavailable | -2.16 |
| Paraguay | 2024 | 2,849.27 | -0.32 |
| Peru | 2024 | 1,637.27 | -0.63 |
| Philippines | 2024 | 988.38 | 0.75 |
| Poland | 2024 | 4,532.81 | 0.97 |
| Portugal | 2024 | 5,293.85 | 0.7 |
| Qatar | 2024 | 19,312.96 | 0.32 |
| Romania | 2024 | 2,682.06 | 0.98 |
| Russian Federation | 2024 | 7,773.85 | 0.23 |
| Rwanda | 2024 | 79.26 | -1.12 |
| Samoa | 2024 | Unavailable | 0.34 |
| San Marino | 2024 | Unavailable | 1.13 |
| Sao Tome and Principe | 2024 | Unavailable | 0.34 |
| Saudi Arabia | 2024 | 11,808.35 | 0.54 |
| Senegal | 2024 | 419.31 | -0.54 |
| Serbia | 2024 | 5,165.74 | 0.75 |
| Seychelles | 2024 | Unavailable | 0.17 |
| Sierra Leone | 2024 | Unavailable | -0.29 |
| Singapore | 2024 | 9,946.73 | 1.54 |
| Sint Maarten (Dutch part) | 2024 | Unavailable | 0.78 |
| Slovak Republic | 2024 | 4,720.15 | 1.11 |
| Slovenia | 2024 | 6,449.66 | 1.28 |
| Solomon Islands | 2024 | Unavailable | -2.07 |
| Somalia, Fed. Rep. | 2024 | Unavailable | -1.66 |
| South Africa | 2024 | 3,308.19 | 0.35 |
| South Sudan | 2024 | 53.17 | -1.37 |
| Spain | 2024 | 5,196.11 | 0.8 |
| Sri Lanka | 2024 | 695.11 | -0.06 |
| St. Kitts and Nevis | 2024 | Unavailable | 0.69 |
| St. Lucia | 2024 | Unavailable | -0.16 |
| St. Vincent and the Grenadines | 2024 | Unavailable | -0.4 |
| Sudan | 2024 | 191.76 | -2.07 |
| Suriname | 2024 | 2,919.15 | 0.16 |
| Sweden | 2024 | 12,251.99 | 1.23 |
| Switzerland | 2024 | 7,117.25 | 1.59 |
| Syrian Arab Republic | 2024 | 660.32 | -0.41 |
| Tajikistan | 2024 | 1,558.88 | -1.45 |
| Tanzania | 2024 | 171.4 | -0.99 |
| Thailand | 2024 | 3,080.43 | 0.81 |
| Timor-Leste | 2024 | Unavailable | -0.7 |
| Togo | 2024 | 242.31 | -0.68 |
| Tonga | 2024 | Unavailable | -0.13 |
| Trinidad and Tobago | 2024 | 6,816.32 | 0.06 |
| Tunisia | 2024 | 1,570.16 | 0.58 |
| Turkiye | 2024 | 3,806.1 | 0.68 |
| Turkmenistan | 2024 | 3,397.29 | -1.2 |
| Turks and Caicos Islands | 2024 | Unavailable | 0.57 |
| Tuvalu | 2024 | Unavailable | -0.03 |
| Uganda | 2024 | 98.67 | -0.57 |
| Ukraine | 2024 | 2,598.61 | 0.33 |
| United Arab Emirates | 2024 | 15,361.36 | 0.45 |
| United Kingdom | 2024 | 4,194.89 | 1.25 |
| United States | 2024 | 12,933.7 | 1.12 |
| Uruguay | 2024 | 4,013.18 | 0.09 |
| Uzbekistan | 2024 | 2,096.87 | 0.2 |
| Vanuatu | 2024 | Unavailable | -1.66 |
| Venezuela, RB | 2024 | 2,361.79 | -1.6 |
| Viet Nam | 2024 | 2,755.87 | 0.67 |
| West Bank and Gaza | 2024 | Unavailable | -0.23 |
| Yemen, Rep. | 2024 | 99.01 | -1.15 |
| Zambia | 2024 | 513.82 | -0.73 |
| Zimbabwe | 2024 | 552.71 | -1.14 |
Sources: World Bank / IEA / Harvard Growth Lab Same-year observations; no interpolation. ECI uses the HS92 goods classification.
Updated analysis · 9 November 2026. Snapshot 2026-11-09-24e8d6ada556. Data definitions & provenance
Association does not establish causation. ECI describes the complexity of goods exports, not every activity in an economy.

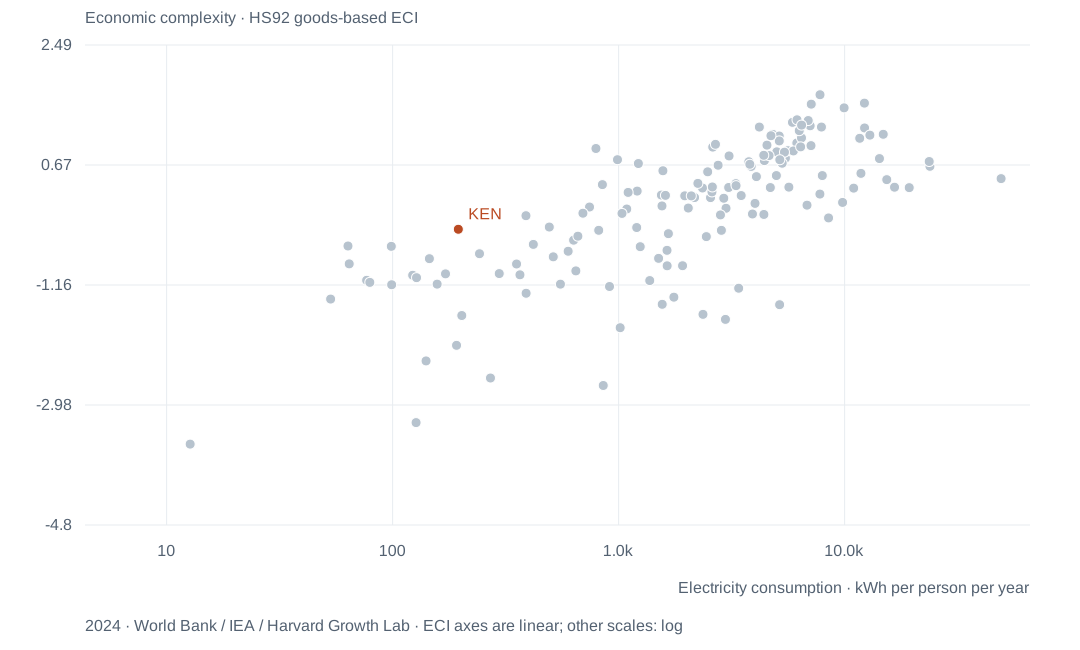
Here we see a strong positive correlation between electricity consumption per capita and the Economic Complexity Index. The more complex goods and services an economy can produce and export the higher its electricity consumption i.e. one man in an advanced automated factory can produce more and higher quality products than several workers labouring in the sun in a developing economy. Here again, we see that the more mature economies can increase their economic complexity without necessarily increasing their electricity consumption because they are now becoming more efficient and effective. As for the still developing nations, until they become mature economies, it seems the best way to develop is to increase their electricity consumption.
6. Scientific Papers Published vs. Economic Complexity Index
Highlight up to six economies. Missing years are not interpolated.
Static view · 2023 · snapshot 2026-11-09-24e8d6ada556. Scroll the static chart horizontally on narrow screens, or use the data table.
View the data table
| Economy | Year | Scientific output | Economic complexity |
|---|---|---|---|
| Afghanistan | 2023 | 4.07 | -1.28 |
| Albania | 2023 | 132.46 | -0.16 |
| Algeria | 2023 | 166.29 | -1.05 |
| American Samoa | 2023 | Unavailable | 0.68 |
| Andorra | 2023 | 137.16 | 1.09 |
| Angola | 2023 | 1.37 | -1.15 |
| Antigua and Barbuda | 2023 | 143.92 | 0.18 |
| Argentina | 2023 | 188.62 | 0.01 |
| Armenia | 2023 | 270.38 | 0.74 |
| Aruba | 2023 | Unavailable | 0.62 |
| Australia | 2023 | 2,047.61 | 0.09 |
| Austria | 2023 | 1,516.22 | 1.37 |
| Azerbaijan | 2023 | 152.08 | -0.52 |
| Bahamas, The | 2023 | 37.5 | -0.01 |
| Bahrain | 2023 | 455.47 | 0.71 |
| Bangladesh | 2023 | 48.17 | -0.62 |
| Barbados | 2023 | 201.14 | 0.37 |
| Belarus | 2023 | 155.74 | 0.84 |
| Belgium | 2023 | 1,427.54 | 1.06 |
| Belize | 2023 | 43.83 | -0.15 |
| Benin | 2023 | 30.98 | -1.01 |
| Bermuda | 2023 | Unavailable | 0.79 |
| Bhutan | 2023 | 130.37 | -0.65 |
| Bolivia | 2023 | 16.07 | -1.3 |
| Bosnia and Herzegovina | 2023 | 339.91 | 0.58 |
| Botswana | 2023 | 154.76 | -0.51 |
| Brazil | 2023 | 276.08 | 0.38 |
| British Virgin Islands | 2023 | Unavailable | 0.53 |
| Brunei Darussalam | 2023 | 1,092.71 | 0.21 |
| Bulgaria | 2023 | 775.35 | 0.81 |
| Burkina Faso | 2023 | 22.57 | -1.13 |
| Burundi | 2023 | 2.65 | -0.7 |
| Cabo Verde | 2023 | 35.11 | 0.24 |
| Cambodia | 2023 | 11.52 | -0.07 |
| Cameroon | 2023 | 54.52 | -1.14 |
| Canada | 2023 | 1,591.04 | 0.83 |
| Cayman Islands | 2023 | Unavailable | 0.07 |
| Central African Republic | 2023 | 5 | -0.31 |
| Chad | 2023 | 2.71 | -2.42 |
| Chile | 2023 | 436.11 | -0.13 |
| China | 2023 | 661.16 | 1.35 |
| Colombia | 2023 | 175.53 | 0.16 |
| Comoros | 2023 | 9.42 | -0.31 |
| Congo, Dem. Rep. | 2023 | 2.3 | -2.45 |
| Congo, Rep. | 2023 | 15.47 | -1.6 |
| Costa Rica | 2023 | 129.43 | 0.23 |
| Cote d'Ivoire | 2023 | 12.57 | -1.07 |
| Croatia | 2023 | 1,425.9 | 0.85 |
| Cuba | 2023 | 110.4 | -1.34 |
| Curacao | 2023 | Unavailable | 0.99 |
| Cyprus | 2023 | 1,311.64 | 0.43 |
| Czechia | 2023 | 1,234.29 | 1.43 |
| Denmark | 2023 | 2,623.71 | 1.04 |
| Djibouti | 2023 | 15.16 | 0.33 |
| Dominica | 2023 | 55.63 | 0.33 |
| Dominican Republic | 2023 | 9.22 | -0.08 |
| Ecuador | 2023 | 196.32 | -1.03 |
| Egypt, Arab Rep. | 2023 | 199.54 | -0.08 |
| El Salvador | 2023 | 10.23 | 0.09 |
| Equatorial Guinea | 2023 | 1.86 | -2.29 |
| Eritrea | 2023 | 8.38 | -1.03 |
| Estonia | 2023 | 1,279.72 | 0.98 |
| Eswatini | 2023 | 25.14 | 0.14 |
| Ethiopia | 2023 | 52.28 | -1.06 |
| Faroe Islands | 2023 | Unavailable | -0.15 |
| Fiji | 2023 | 235.75 | -0.22 |
| Finland | 2023 | 2,010.1 | 1.3 |
| France | 2023 | 909.44 | 1.18 |
| French Polynesia | 2023 | Unavailable | 0.46 |
| Gabon | 2023 | 36.45 | -0.79 |
| Gambia, The | 2023 | 29.58 | -1.46 |
| Georgia | 2023 | 174.83 | 0.23 |
| Germany | 2023 | 1,306.11 | 1.5 |
| Ghana | 2023 | 96.78 | -0.81 |
| Gibraltar | 2023 | Unavailable | 0.64 |
| Greece | 2023 | 1,302.12 | 0.44 |
| Greenland | 2023 | 675.64 | -0.7 |
| Grenada | 2023 | 362.91 | 0.19 |
| Guam | 2023 | Unavailable | 0.23 |
| Guatemala | 2023 | 6 | -0.07 |
| Guinea | 2023 | 3.81 | -1.59 |
| Guinea-Bissau | 2023 | 6.36 | -2.24 |
| Guyana | 2023 | 60.03 | -0.64 |
| Haiti | 2023 | 3.25 | -1.14 |
| Honduras | 2023 | 12.25 | -0.47 |
| Hong Kong SAR, China | 2023 | Unavailable | 1.3 |
| Hungary | 2023 | 861.17 | 1.22 |
| Iceland | 2023 | 1,856.47 | 0.45 |
| India | 2023 | 158.67 | 0.71 |
| Indonesia | 2023 | 138.67 | 0.28 |
| Iran, Islamic Rep. | 2023 | 607.95 | -0.13 |
| Iraq | 2023 | 371.04 | -1.44 |
| Ireland | 2023 | 1,641.64 | 1.23 |
| Israel | 2023 | 1,405.65 | 1.18 |
| Italy | 2023 | 1,403.27 | 1.21 |
| Jamaica | 2023 | 56.84 | -0.45 |
| Japan | 2023 | 775.35 | 1.91 |
| Jordan | 2023 | 473.74 | 0.04 |
| Kazakhstan | 2023 | 187.83 | 0.43 |
| Kenya | 2023 | 37.57 | -0.4 |
| Kiribati | 2023 | 16.15 | -0.05 |
| Korea, Dem. People's Rep. | 2023 | 10.19 | 1.23 |
| Korea, Rep. | 2023 | 1,386.98 | 1.72 |
| Kosovo | 2023 | 294.38 | Unavailable |
| Kuwait | 2023 | 287.43 | 0.06 |
| Kyrgyz Republic | 2023 | 46.05 | 0.1 |
| Lao PDR | 2023 | 9.42 | -0.87 |
| Latvia | 2023 | 921.62 | 0.76 |
| Lebanon | 2023 | 360.15 | 0.39 |
| Lesotho | 2023 | 26.04 | -0.64 |
| Liberia | 2023 | 5.74 | -1.46 |
| Libya | 2023 | 60.65 | -1.99 |
| Liechtenstein | 2023 | 1,285.2 | Unavailable |
| Lithuania | 2023 | 930.88 | 0.89 |
| Luxembourg | 2023 | 1,764.25 | 1.11 |
| Macao SAR, China | 2023 | Unavailable | 0.81 |
| Madagascar | 2023 | 4.92 | -1.2 |
| Malawi | 2023 | 17.89 | -1.24 |
| Malaysia | 2023 | 674.45 | 0.95 |
| Maldives | 2023 | 60.34 | -0.59 |
| Mali | 2023 | 4.91 | -0.88 |
| Malta | 2023 | 900.54 | 1.06 |
| Marshall Islands | 2023 | 23.69 | -0.42 |
| Mauritania | 2023 | 9.33 | -1.29 |
| Mauritius | 2023 | 164.43 | 0.16 |
| Mexico | 2023 | 146.31 | 0.96 |
| Micronesia, Fed. Sts. | 2023 | 33.21 | -0.72 |
| Moldova | 2023 | 136.33 | 0.19 |
| Monaco | 2023 | 955.69 | Unavailable |
| Mongolia | 2023 | 79.53 | -1.18 |
| Montenegro | 2023 | 408.43 | 0.47 |
| Morocco | 2023 | 257.87 | -0.2 |
| Mozambique | 2023 | 6.09 | -1.65 |
| Myanmar | 2023 | 4.32 | -1.04 |
| Namibia | 2023 | 78.07 | -0.75 |
| Naoero | 2023 | 10.95 | 0.99 |
| Nepal | 2023 | 53.57 | -0.1 |
| Netherlands | 2023 | 1,801.58 | 1 |
| New Caledonia | 2023 | Unavailable | -0.69 |
| New Zealand | 2023 | 1,556.97 | 0.47 |
| Nicaragua | 2023 | 5.96 | -1.11 |
| Niger | 2023 | 3.45 | -1 |
| Nigeria | 2023 | 43 | -2.33 |
| North Macedonia | 2023 | 272.99 | 0.3 |
| Northern Mariana Islands | 2023 | Unavailable | 0.68 |
| Norway | 2023 | 2,492.24 | 0.73 |
| Oman | 2023 | 324.86 | -0.27 |
| Pakistan | 2023 | 82.9 | -0.39 |
| Palau | 2023 | 284.31 | -0.06 |
| Panama | 2023 | 63.25 | 0.15 |
| Papua New Guinea | 2023 | 6.71 | -1.63 |
| Paraguay | 2023 | 37.02 | -0.53 |
| Peru | 2023 | 154.87 | -0.71 |
| Philippines | 2023 | 41.36 | 0.71 |
| Poland | 2023 | 850.93 | 1.03 |
| Portugal | 2023 | 1,722.91 | 0.69 |
| Puerto Rico (US) | 2023 | 188.72 | Unavailable |
| Qatar | 2023 | 930.44 | -0.13 |
| Romania | 2023 | 562.03 | 1.02 |
| Russian Federation | 2023 | 594.87 | 0.24 |
| Rwanda | 2023 | 31.07 | -1.02 |
| Samoa | 2023 | 100.85 | 0.12 |
| San Marino | 2023 | 593.33 | 1.21 |
| Sao Tome and Principe | 2023 | 20.4 | 0.1 |
| Saudi Arabia | 2023 | 729.76 | 0.48 |
| Senegal | 2023 | 27.08 | -0.78 |
| Serbia | 2023 | 781.06 | 0.78 |
| Seychelles | 2023 | 126.66 | 0.26 |
| Sierra Leone | 2023 | 10.2 | -0.33 |
| Singapore | 2023 | 2,009.85 | 1.68 |
| Sint Maarten (Dutch part) | 2023 | Unavailable | 0.95 |
| Slovak Republic | 2023 | 982.58 | 1.2 |
| Slovenia | 2023 | 1,682.45 | 1.36 |
| Solomon Islands | 2023 | 18.55 | -1.91 |
| Somalia, Fed. Rep. | 2023 | 8.27 | -2.16 |
| South Africa | 2023 | 236.49 | 0.29 |
| South Sudan | 2023 | 1.5 | -2.3 |
| Spain | 2023 | 1,247.17 | 0.81 |
| Sri Lanka | 2023 | 105.36 | -0.2 |
| St. Kitts and Nevis | 2023 | 759.23 | 0.52 |
| St. Lucia | 2023 | 14.17 | -0.02 |
| St. Vincent and the Grenadines | 2023 | 26.55 | -0.45 |
| Sudan | 2023 | 9.4 | -2.58 |
| Suriname | 2023 | 41.88 | -0.39 |
| Sweden | 2023 | 2,016.17 | 1.38 |
| Switzerland | 2023 | 2,565.45 | 1.78 |
| Syrian Arab Republic | 2023 | 27.37 | -0.65 |
| Tajikistan | 2023 | 15.24 | -1.01 |
| Tanzania | 2023 | 21.8 | -1.11 |
| Thailand | 2023 | 232.3 | 0.85 |
| Timor-Leste | 2023 | 14.95 | -0.67 |
| Togo | 2023 | 16.53 | -1.23 |
| Tonga | 2023 | 46.37 | 0.02 |
| Trinidad and Tobago | 2023 | 179.57 | 0.07 |
| Tunisia | 2023 | 450.22 | 0.49 |
| Turkiye | 2023 | 588.1 | 0.68 |
| Turkmenistan | 2023 | 4.25 | -1.34 |
| Turks and Caicos Islands | 2023 | Unavailable | 0.62 |
| Tuvalu | 2023 | 42.79 | 0.79 |
| Uganda | 2023 | 29.26 | -0.74 |
| Ukraine | 2023 | 410.74 | 0.45 |
| United Arab Emirates | 2023 | 674.87 | 0.7 |
| United Kingdom | 2023 | 1,423.34 | 1.38 |
| United States | 2023 | 1,279.4 | 1.23 |
| Uruguay | 2023 | 312.81 | 0.03 |
| Uzbekistan | 2023 | 129.71 | 0.21 |
| Vanuatu | 2023 | 37.05 | -1.66 |
| Venezuela, RB | 2023 | 16.77 | -1.33 |
| Viet Nam | 2023 | 106.07 | 0.58 |
| West Bank and Gaza | 2023 | 166.8 | 0.23 |
| Yemen, Rep. | 2023 | 10.26 | -1.51 |
| Zambia | 2023 | 17.72 | -0.71 |
| Zimbabwe | 2023 | 31.81 | -1.13 |
Sources: World Bank / NSF / Harvard Growth Lab Same-year observations; no interpolation. Fractional counts are preserved; population adjustment uses the same observation year.
Updated analysis · 9 November 2026. Snapshot 2026-11-09-24e8d6ada556. Data definitions & provenance
Association does not establish causation. Publication counts measure output, not research quality. ECI describes the complexity of goods exports, not every activity in an economy.

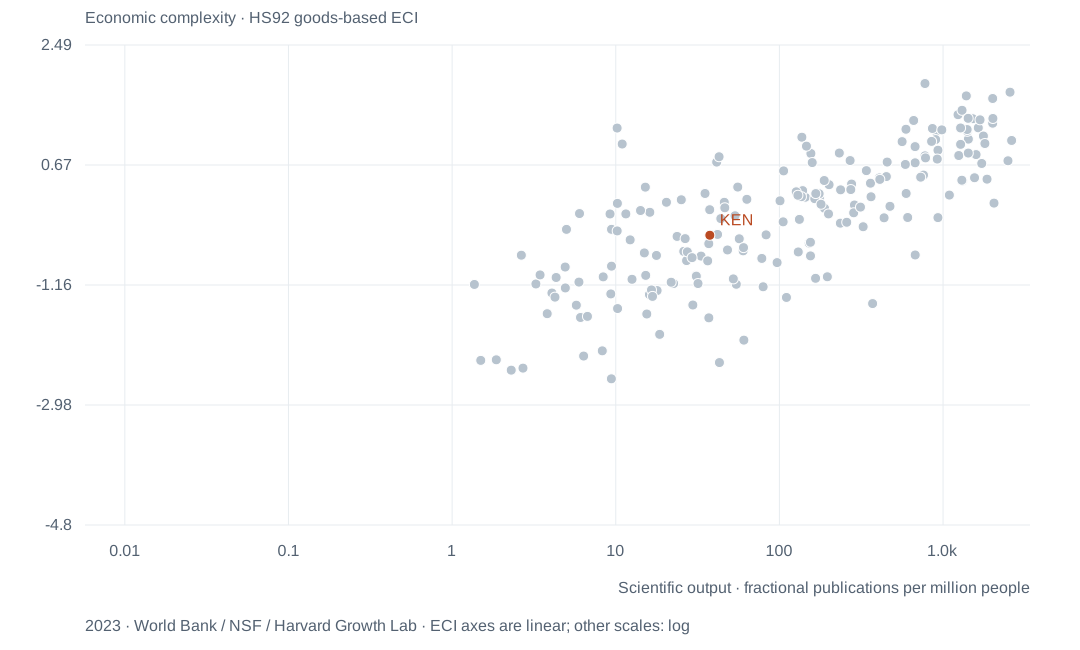
From this chart, we can conclude that one of the best ways to create a complex economy is to invest in research and development. China, which has invested heavily in research and development for the past two decades has seen a corresponding rise in the complexity of the goods and services it produces and exports. Japan, Germany, the UK, etc. also demonstrate highly complex economies in tandem with their high GDP per capita.
Conclusion
From this investigation, we can conclude the following:
-
To move from developing to rapidly developing and finally to a mature developed economy, a nation must lay the necessary groundwork in terms of access to cheap and reliable energy for its citizens. There is no substitute for this step. Every nation first has to harness energy to multiply the productivity of its workers to develop. We have seen how China and other rapidly developing nations are doing this and we have seen how Kenya has remained stagnant because of not taking this step.
-
For long-term economic gains, a nation must invest in high-quality education, research and the development of new products/ideas from the research. This is a precursor to developing a complex economy and there is no escaping this. No amount of external loans or grants will ever replace this. A nation has to develop and deploy intellectual property to develop complexity in the economy. The Americans, for example, applied physics to the development of the atomic bomb and from this, they won the Second World War, catapulted themselves into a superpower and developed several other technologies from this research like nuclear weapons. Their military also developed the internet, and now the USA is reaping huge dividends from the internet.
-
Nations also have to intentionally set the stage for organic economic complexity i.e. systems that work, and the freedom to work and be creative. Something simple like the physical addressing system in the Western world enabled the establishment of efficient and effective delivery systems like Amazon. Their political system of democracy and freedom for all also encourages their populace to be daring and entrepreneurial in their pursuits and also attracts immigrants from all over the world who go to these countries and add value to their economies. Contrast this with China which has a capitalistic economic system but a socialist political system. China is certainly making rapid development progress but how sustainable is it? Does it attract the best and brightest from other cultures?
-
Finally, there has been a lot of talk and action in the climate change area. Mature economies have become more conscious of their energy footprints and are taking steps towards becoming more energy efficient and that is why we see them increasing their GDP per capita without a corresponding increase in electricity consumption. As for developing nations, this may be difficult as the data suggests that first, you have to multiply your worker productivity by consuming more energy per capita until your economy stabilizes then you can begin taking steps towards efficiency. It is like teaching a baby to first walk in halting unsteady steps before they can properly walk and then they can learn to run fast and efficiently. From this, I would like to caution developing countries to be careful when adopting green energy policies copied from developed nations since they are not operating in the same economic environment as the mature economies. The most important thing for developing nations is first to multiply worker productivity then, economic complexity and finally efficiency.
-
https://www.cgdev.org/blog/what-development ↩
-
https://www.investopedia.com/terms/p/per-capita-gdp.asp ↩
-
https://oec.world/en/rankings/eci/hs6/hs96?year2=2024&showAll=true ↩
-
https://data.worldbank.org/ ↩
-
https://en.wikipedia.org/wiki/List_of_countries_by_oil_production ↩
-
https://atlas.cid.harvard.edu/rankings ↩
-
https://www.eiu.com/n/campaigns/democracy-index-2022/ ↩
-
https://worldpopulationreview.com/country-rankings/gini-coefficient-by-country ↩
-
Makhtar Diop, World Bank’s Vice President for Africa. (2017, December 1). Innovation in Africa. World Bank. https://www.worldbank.org/en/news/speech/2017/11/30/innovation-in-africa ↩